


Introduction
The universe is vast and filled with countless stars, each at different stages of their life cycle. Understanding how these celestial bodies evolve over time is crucial to our knowledge of astrophysics. One of the most important tools used by astronomers to study stars is the Hertzsprung-Russell (HR) Diagram. This graph visually represents the relationship between a star’s luminosity (brightness) and surface temperature, providing a clear picture of stellar evolution.
Developed independently by Danish astronomer Ejnar Hertzsprung and American astronomer Henry Norris Russell in the early 20th century, the HR Diagram has become a cornerstone of modern astrophysics. It allows scientists to classify stars based on their spectral characteristics and evolutionary stage. Whether a star is in its main sequence phase, evolving into a red giant, or cooling down as a white dwarf, its position on the HR Diagram tells a compelling story about its past, present, and future.
In this article, we will delve into the structure of the HR Diagram, its major regions, and how it helps astronomers track stellar evolution. We will also explore its modern applications in space research, proving why this tool remains indispensable in the study of the cosmos.
What is the HR Diagram?
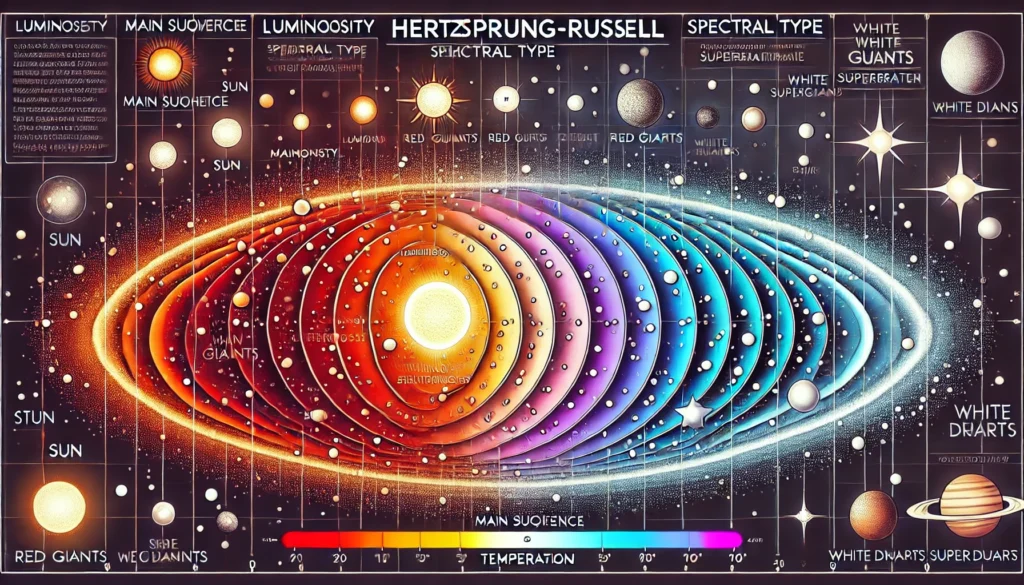
The Hertzsprung-Russell Diagram is a graphical representation of stars based on two key properties: their luminosity (or absolute magnitude) and their surface temperature. The x-axis of the diagram represents the temperature of a star, which decreases from left to right—a counterintuitive but scientifically consistent approach. The y-axis, on the other hand, represents the luminosity of a star relative to the Sun, increasing upwards.
The HR Diagram provides astronomers with a structured way to classify stars into different groups based on their properties. Unlike simple brightness charts, the HR Diagram offers a deeper understanding of a star’s life cycle and its physical characteristics. Stars with high temperature and high luminosity, such as blue giants, are positioned at the top left, while cooler and dimmer stars, like red dwarfs, are found at the bottom right.
There are two main types of HR Diagrams: observational and theoretical. The observational HR Diagram is based on real data collected from telescopes, plotting a star’s color against its brightness. The theoretical HR Diagram, on the other hand, uses models to predict where stars should be located based on their intrinsic properties. Both variations help astronomers understand stellar evolution and the complex interactions between temperature, mass, and luminosity.
Key Regions and Features of the HR Diagram

Main Sequence
The majority of stars in the universe, including our Sun, lie along the main sequence of the HR Diagram. This diagonal band stretches from the top left (hot, luminous stars) to the bottom right (cool, dim stars). Stars in this phase are undergoing hydrogen fusion in their cores, which generates the energy that powers their light. The position of a star on the main sequence is determined primarily by its mass; more massive stars burn fuel faster and have shorter lifespans, while smaller stars, like red dwarfs, can last for billions of years.
Giants and Supergiants
Above the main sequence, in the upper right region of the HR Diagram, we find giant and supergiant stars. These are massive, evolved stars that have exhausted the hydrogen in their cores and are now fusing heavier elements like helium or even carbon and oxygen. Giants, such as red giants, have expanded outer layers and increased luminosity despite their lower surface temperatures. Supergiants, like Betelgeuse, are even more extreme, often living only a few million years before undergoing a supernova explosion.
White Dwarfs
Located in the lower left of the HR Diagram, white dwarfs are the remnants of low-mass stars that have exhausted their nuclear fuel. These stars no longer undergo fusion, but they remain extremely hot due to residual thermal energy. White dwarfs are incredibly dense—imagine squeezing the mass of the Sun into an Earth-sized object. Over time, they will cool and fade, eventually becoming black dwarfs, though the universe is not old enough for any black dwarfs to exist yet.
How the HR Diagram Explains Stellar Evolution
Birth of Stars
Stars begin their lives as dense clouds of gas and dust in space. Under the influence of gravity, these clouds collapse to form protostars, which gradually heat up as they contract. When the core temperature reaches around 10 million Kelvin, hydrogen fusion ignites, marking the beginning of the main sequence phase. The HR Diagram helps scientists visualize this process by showing how protostars move from cooler, less luminous regions to the main sequence.
Main Sequence Lifespan
The duration a star spends on the main sequence depends on its mass. High-mass stars burn fuel quickly and may only last a few million years, while lower-mass stars, like red dwarfs, can continue fusing hydrogen for trillions of years. This phase represents a stable period where the outward pressure from nuclear fusion balances the inward pull of gravity, maintaining the star’s structure.
Post-Main Sequence Evolution and Stellar Death
As a star depletes its hydrogen fuel, it moves off the main sequence. Low-mass stars expand into red giants before shedding their outer layers and forming white dwarfs. More massive stars undergo more dramatic transformations, often becoming supergiants before exploding in a supernova. These explosive events leave behind neutron stars or black holes, depending on the star’s initial mass. The HR Diagram helps astronomers track these evolutionary changes and predict the fate of different types of stars.
Applications and Modern Uses of the HR Diagram
Stellar Classification
Astronomers use the HR Diagram to classify stars based on their spectral type. The classification system ranges from hot O-type stars to cool M-type stars, covering a wide range of stellar characteristics. This classification is crucial for studying stellar populations and galaxy formation.
Astrophysical Research and Space Exploration
The HR Diagram is essential in astrophysics, helping researchers understand the composition and age of star clusters. By plotting stars from a single cluster on the diagram, scientists can determine the cluster’s approximate age and evolutionary state. Additionally, space missions like the Hubble Space Telescope and Gaia have provided precise measurements of stellar properties, further refining our understanding of the HR Diagram.
Conclusion
The HR Diagram is one of the most valuable tools in modern astrophysics. By mapping stars based on luminosity and temperature, it provides crucial insights into stellar evolution, from their formation to their eventual fate. Whether used for classifying stars, studying star clusters, or exploring the deeper workings of the universe, the HR Diagram remains indispensable for astronomers.
As space exploration and technology continue to advance, future observations will refine and expand our knowledge of stars and their life cycles. The HR Diagram will undoubtedly continue to play a central role in unraveling the mysteries of the cosmos.
FAQs About the HR Diagram
What does the HR Diagram show?
The HR Diagram illustrates the relationship between a star’s temperature and luminosity, helping astronomers classify stars and track their evolution.
Why is the HR Diagram important?
It provides insights into stellar life cycles, from their birth to their eventual demise, and helps scientists study star clusters and galaxies.
Where is the Sun on the HR Diagram?
The Sun is located in the middle of the main sequence as a G-type star, indicating it is in a stable hydrogen-fusing phase.
How does the HR Diagram help in astrophysics?
It aids in understanding star formation, classifying stellar populations, and determining the ages of star clusters.
Can the HR Diagram be used for galaxies?
Yes, astronomers use HR Diagrams to analyze stellar populations within galaxies and gain insights into their evolution.